Configure Monitoring Behavior With Prometheus
This document provides the step-by-step instruction to set up monitoring for your application.
As of today, kusion supports the configuration of Prometheus scraping behaviors for the target application. In the future, we will add more cloud-provider-native solutions, such as AWS CloudWatch, Azure Monitor, etc.
The demo sample is mainly composed of the following components:
- Namespace
- Deployment
- Service
- ServiceMonitor
This guide requires you to have a basic understanding of Kubernetes and Prometheus. If you are not familiar with the relevant concepts, please refer to the links below:
Pre-requisite
Please refer to the prerequisites in the guide for deploying an application.
The example below also requires you to have initialized the project using the kusion init command, which will generate a kcl.mod file under the project directory.
Setting up your own Prometheus
There a quite a few ways to set up Prometheus in your cluster:
- Installing a Prometheus operator
- Installing a standalone Prometheus server
- Installing a Prometheus agent and connect to a remote Prometheus server
The advice from the Prometheus team is to use the ServiceMonitor or PodMonitor CRs via the Prometheus operator to manage scrape configs going forward[2].
In either case, you only have to do this setup once per cluster. This doc will use a minikube cluster and Prometheus operator as an example.
Installing Prometheus operator[3].
To get the example in this user guide working, all you need is a running Prometheus operator. You can have that installed by running:
LATEST=$(curl -s https://api.github.com/repos/prometheus-operator/prometheus-operator/releases/latest | jq -cr .tag_name)
curl -sL https://github.com/prometheus-operator/prometheus-operator/releases/download/${LATEST}/bundle.yaml | kubectl create -f -
This will install all the necessary CRDs and the Prometheus operator itself in the default namespace. Wait a few minutes, you can confirm the operator is up by running:
kubectl wait --for=condition=Ready pods -l app.kubernetes.io/name=prometheus-operator -n default
Make sure RBAC is properly set up
If you have RBAC enabled on the cluster, the following must be created for Prometheus to work properly:
apiVersion: v1
kind: ServiceAccount
metadata:
  name: prometheus
---
apiVersion: rbac.authorization.k8s.io/v1
kind: ClusterRole
metadata:
  name: prometheus
rules:
- apiGroups: [""]
  resources:
  - nodes
  - nodes/metrics
  - services
  - endpoints
  - pods
  verbs: ["get", "list", "watch"]
- apiGroups: [""]
  resources:
  - configmaps
  verbs: ["get"]
- apiGroups:
  - networking.k8s.io
  resources:
  - ingresses
  verbs: ["get", "list", "watch"]
- nonResourceURLs: ["/metrics"]
  verbs: ["get"]
---
apiVersion: rbac.authorization.k8s.io/v1
kind: ClusterRoleBinding
metadata:
  name: prometheus
roleRef:
  apiGroup: rbac.authorization.k8s.io
  kind: ClusterRole
  name: prometheus
subjects:
- kind: ServiceAccount
  name: prometheus
  namespace: default
Configure Prometheus instance via the operator
Once all of the above is set up, you can then configure the Prometheus instance via the operator:
apiVersion: monitoring.coreos.com/v1
kind: Prometheus
metadata:
  name: prometheus
spec:
  serviceAccountName: prometheus
  serviceMonitorNamespaceSelector: {}
  serviceMonitorSelector: {}
  podMonitorNamespaceSelector: {}
  podMonitorSelector: {}
  resources:
    requests:
      memory: 400Mi
This Prometheus instance above will be cluster-wide, picking up ALL the service monitors and pod monitors across ALL the namespaces. You can adjust the requests and limits accordingly if you have a larger cluster.
Exposing the Prometheus portal (optional)
Once you have the managed Prometheus instance created via the Prometheus CR above, you should be able to see a service created called prometheus-operated:

If you are also running on minikube, you can expose it onto your localhost via kubectl:
kubectl port-forward svc/prometheus-operated 9099:9090
You should then be able to see the Prometheus portal via localhost:9099 in your browser:
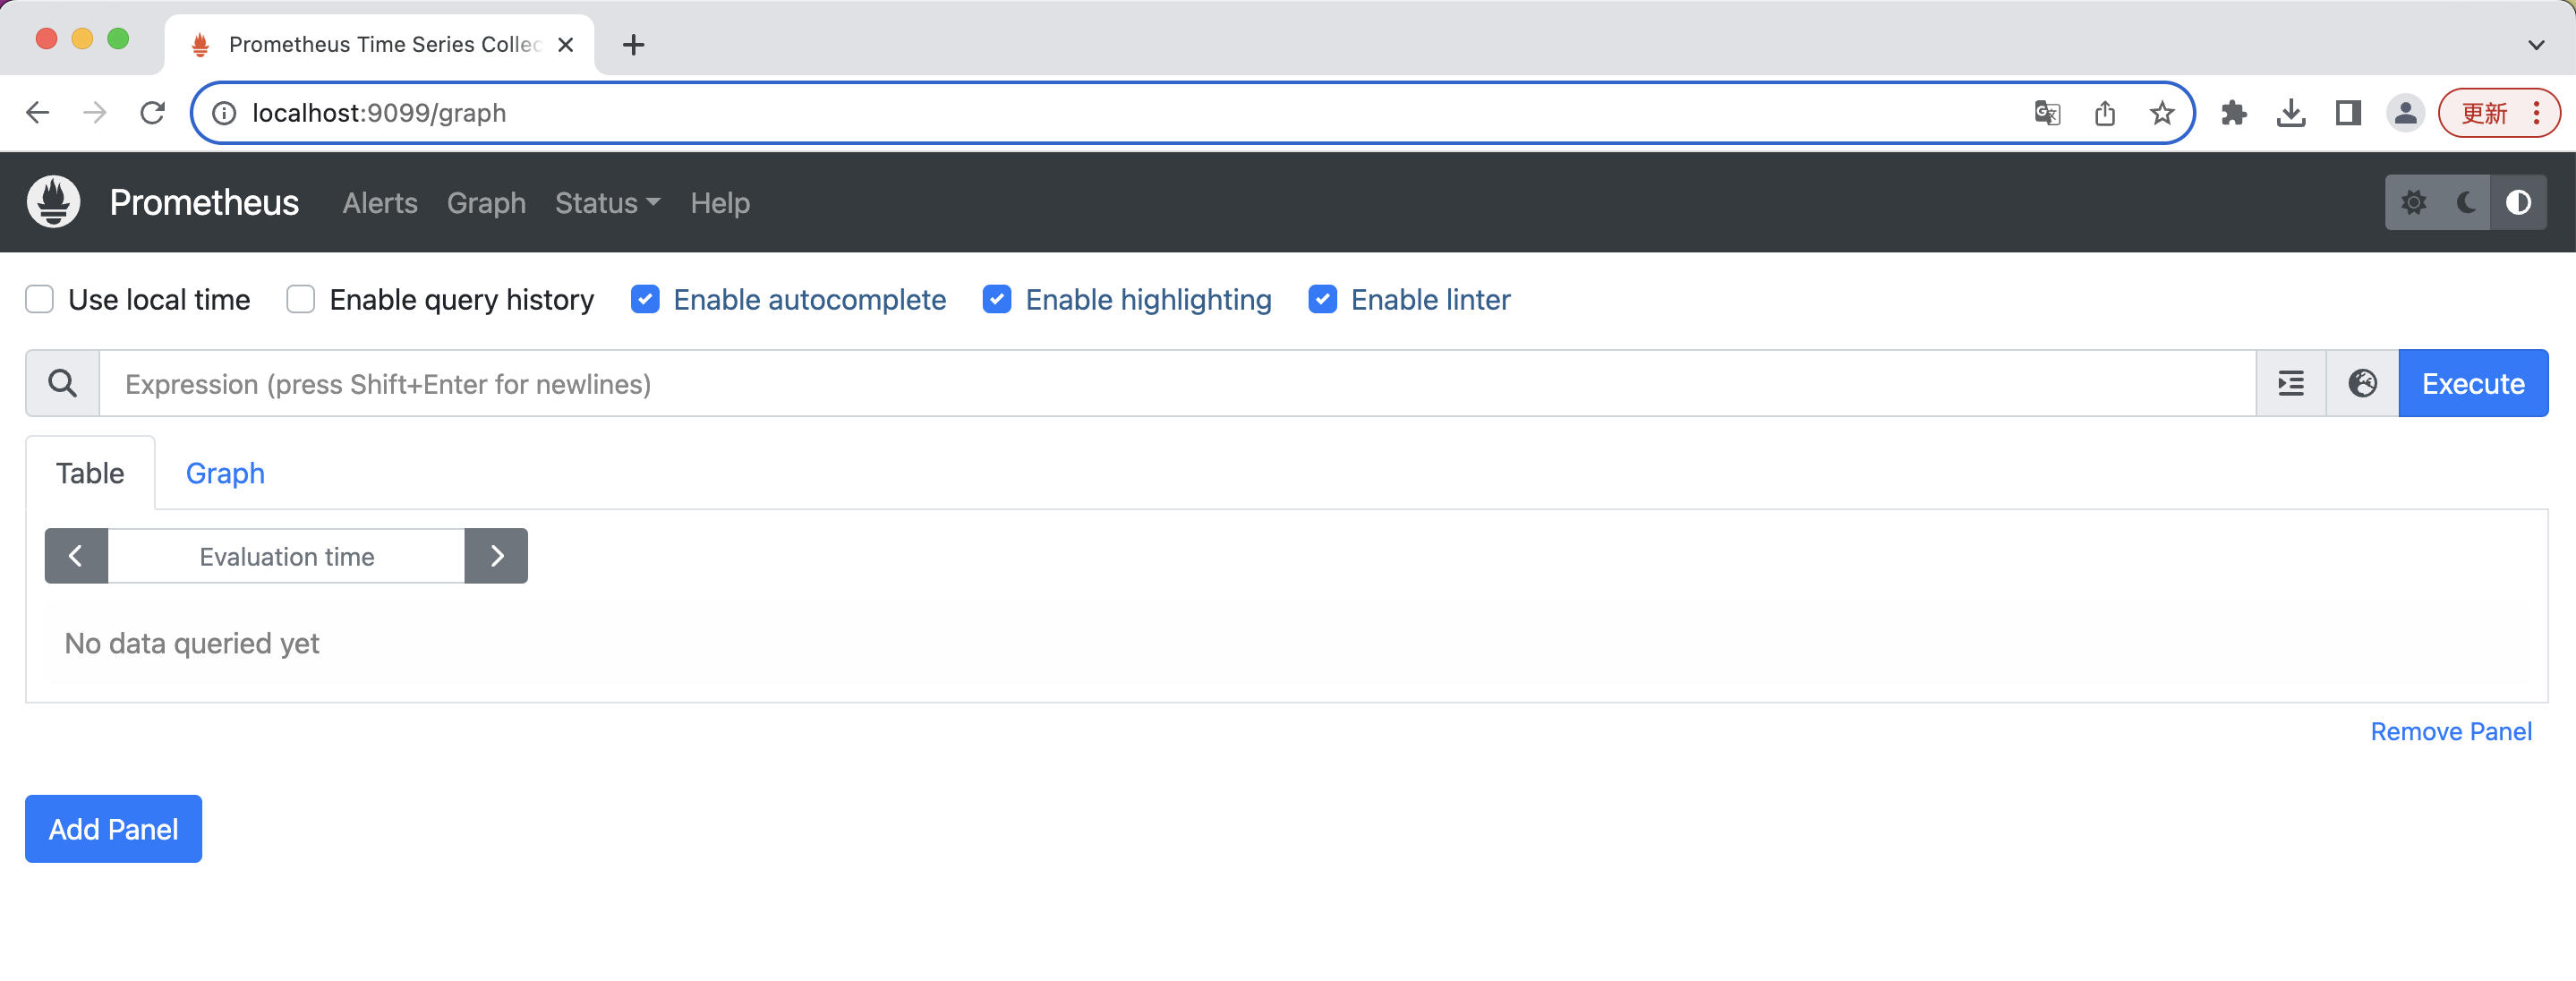
If you are running a non-local cluster, you can try to expose it via another way, through an ingress controller for example.
Using kusion to deploy your application with monitoring requirements
At this point we are set up for good! Any new applications you deploy via kusion will now automatically have the monitoring-related resources created, should you declare you want it via the monitoring field in the AppConfiguration model.
The monitoring in an AppConfiguration is declared in the monitoring field. See the example below for a full, deployable AppConfiguration.
Please note we are using a new image quay.io/brancz/prometheus-example-app since the app itself need to expose metrics for Prometheus to scrape:
helloworld/dev/main.k:
import catalog.models.schema.v1 as ac
import catalog.models.schema.v1.workload as wl
import catalog.models.schema.v1.workload.container as c
import catalog.models.schema.v1.monitoring as m
import catalog.models.schema.v1.workload.network as n

helloworld: ac.AppConfiguration {
    workload: wl.Service {
        containers: {
            "monitoring-sample-app": c.Container {
                image: "quay.io/brancz/prometheus-example-app:v0.3.0"
            }
        }
        ports: [
            n.Port {
                port: 8080
            }
        ]
    }
    monitoring: m.Prometheus{
        interval:       "30s"
        timeout:        "15s"
        path:           "/metrics"
        scheme:         "http"
    }
}
The KCL file above represents an application with a service type workload, exposing the port 8080, and would like Prometheus to scrape the /metrics endpoint every 30 seconds.
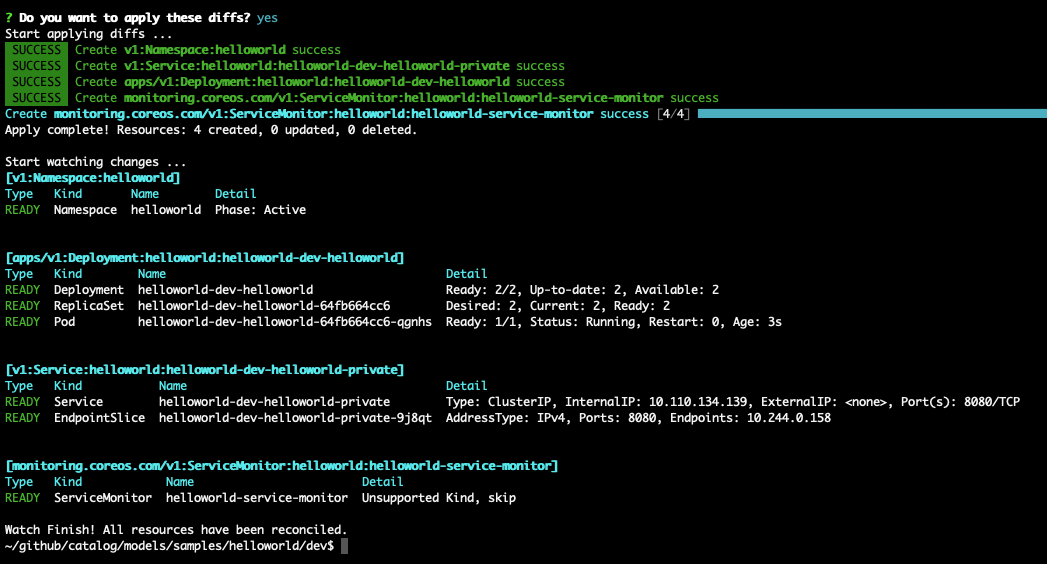
Running kusion apply would show that kusion will create a Namespace, a Deployment, a Service and a ServiceMonitor:

Continue applying all resources:
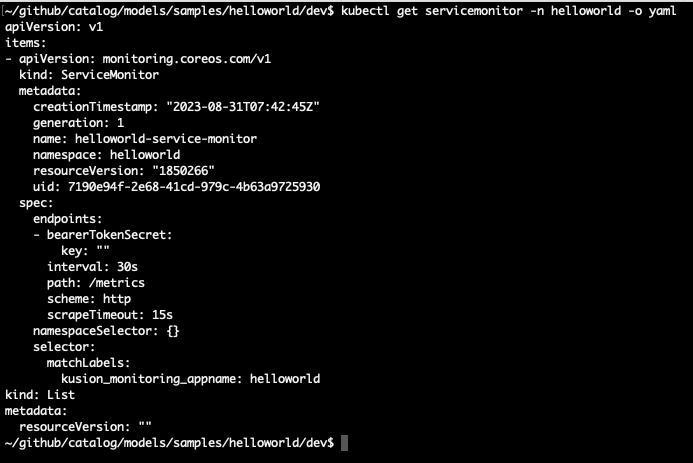
If we want to, we can verify the service monitor has been created successfully:
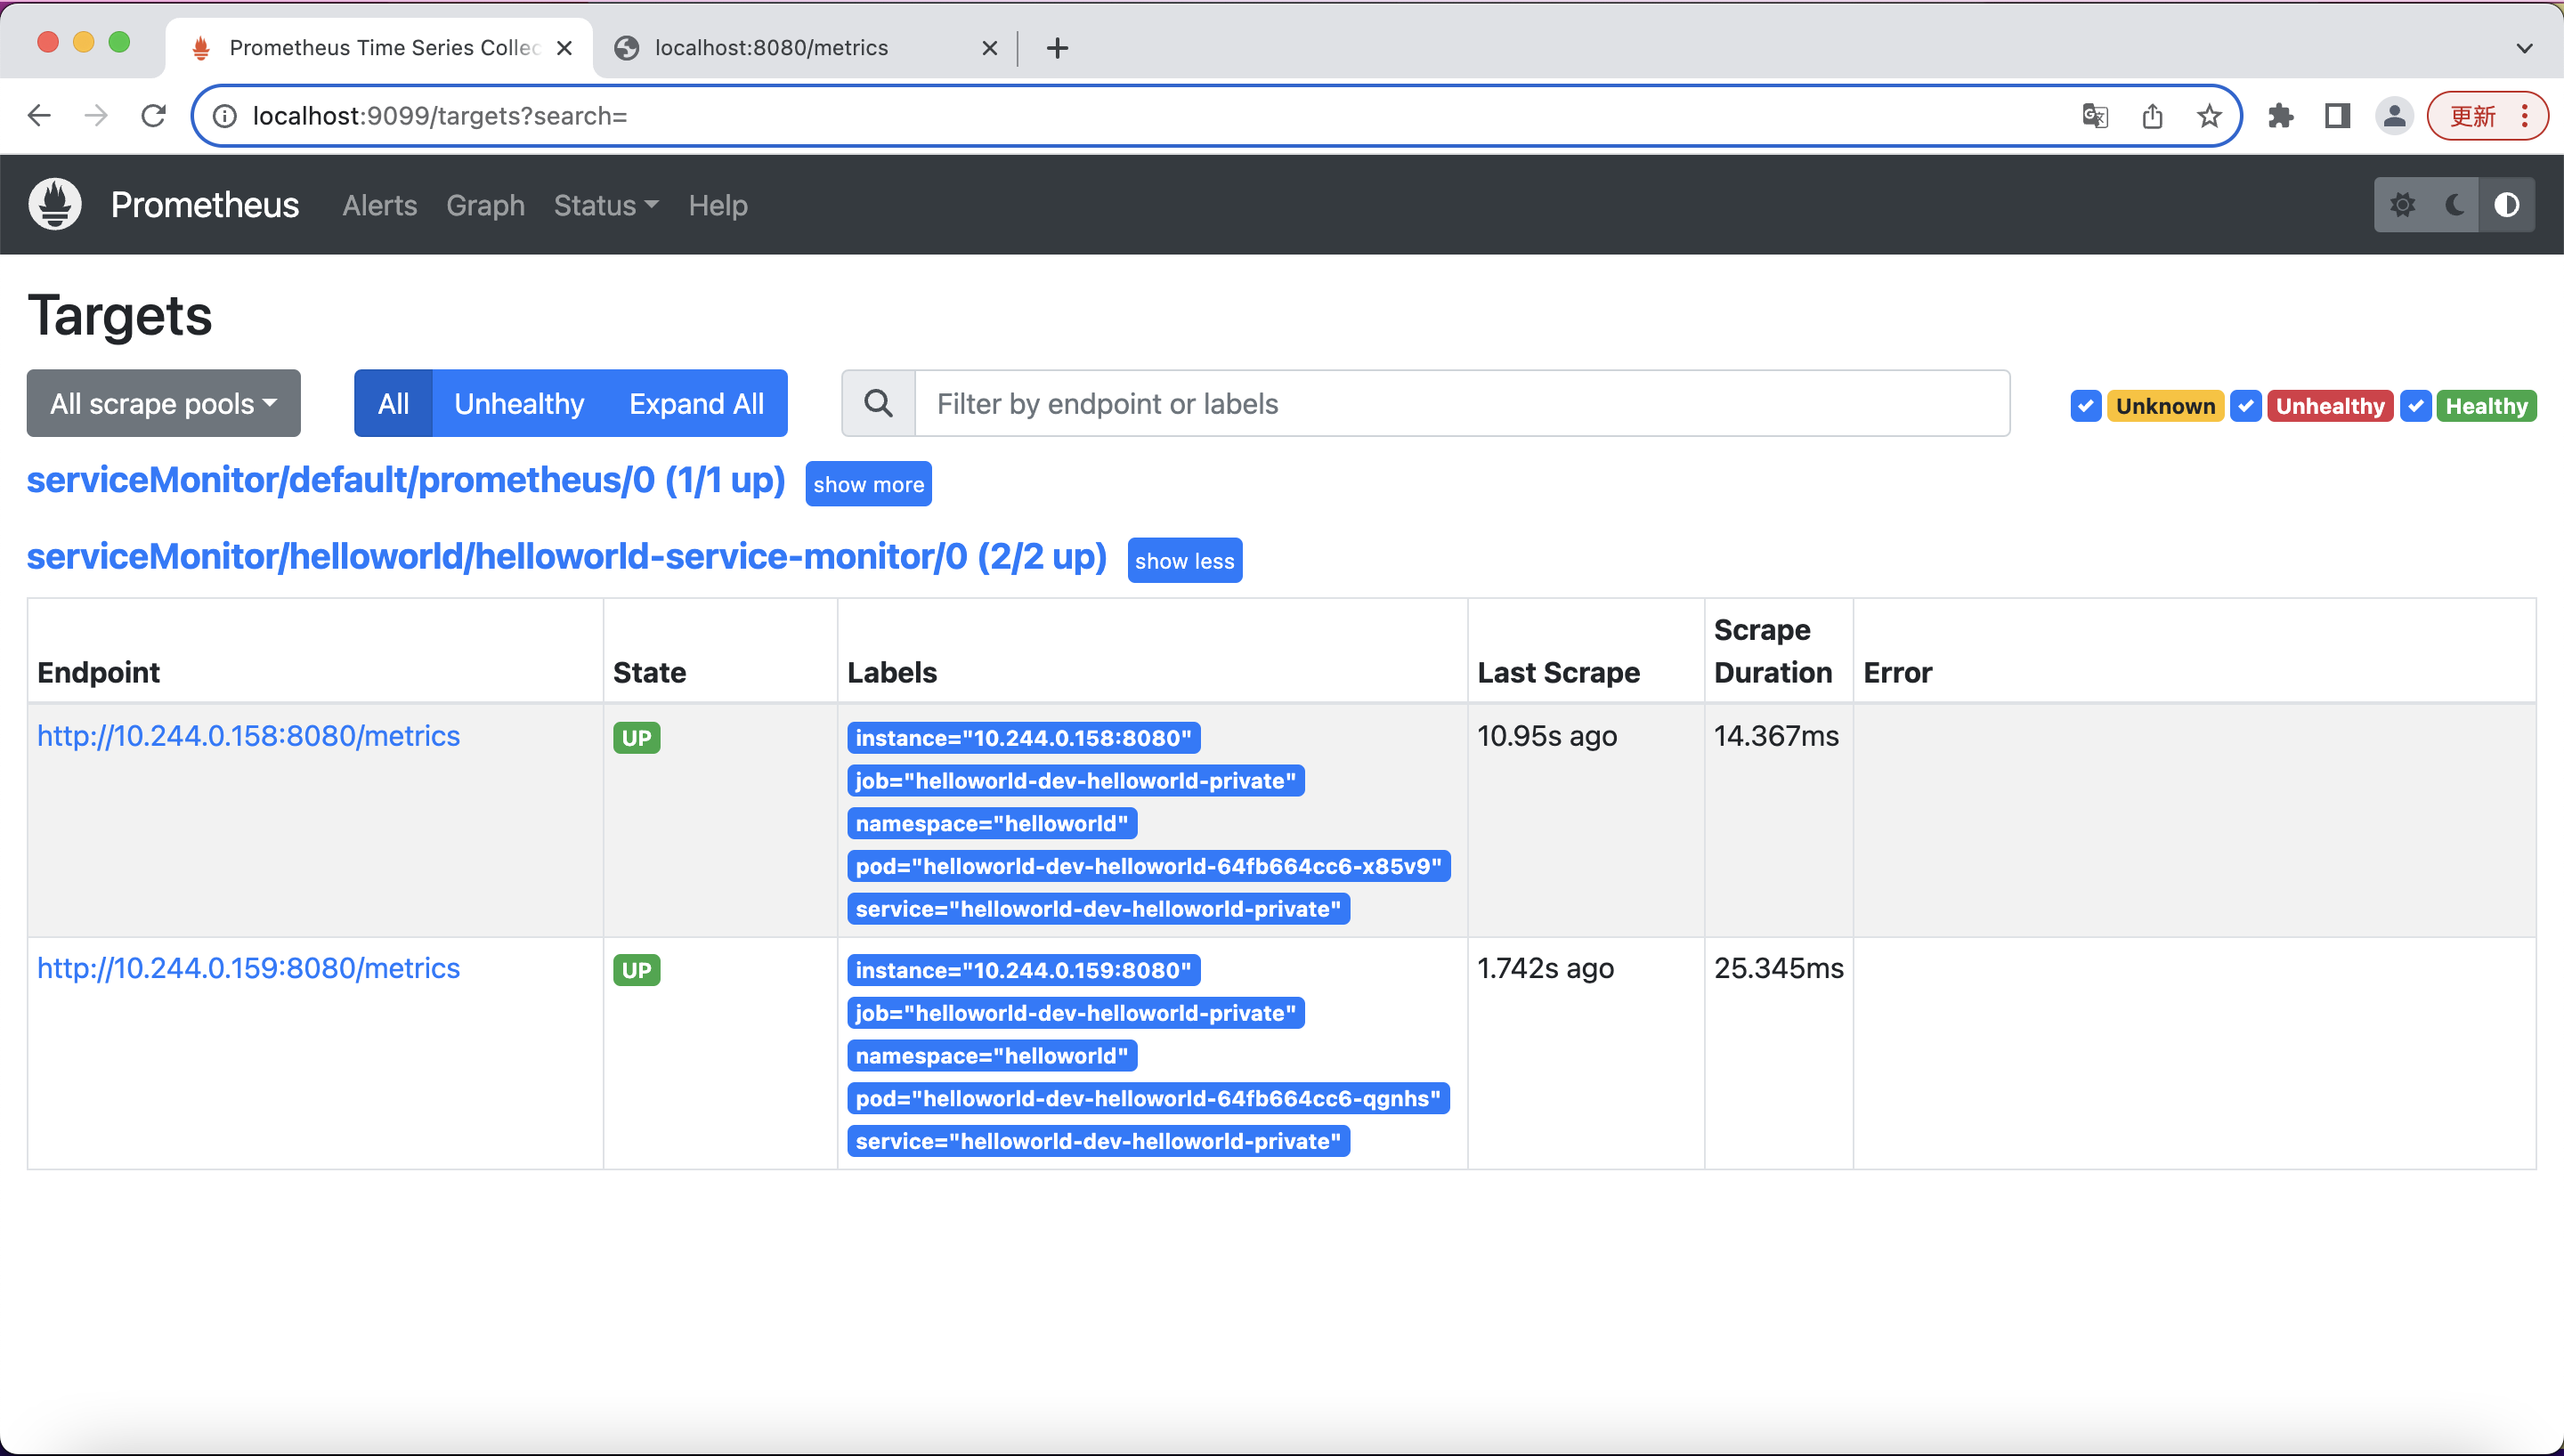
In a few seconds, you should be able to see in the Prometheus portal that the service we just deployed has now been discovered and monitored by Prometheus:
You can run a few simply queries for the data that Prometheus scraped from your application:
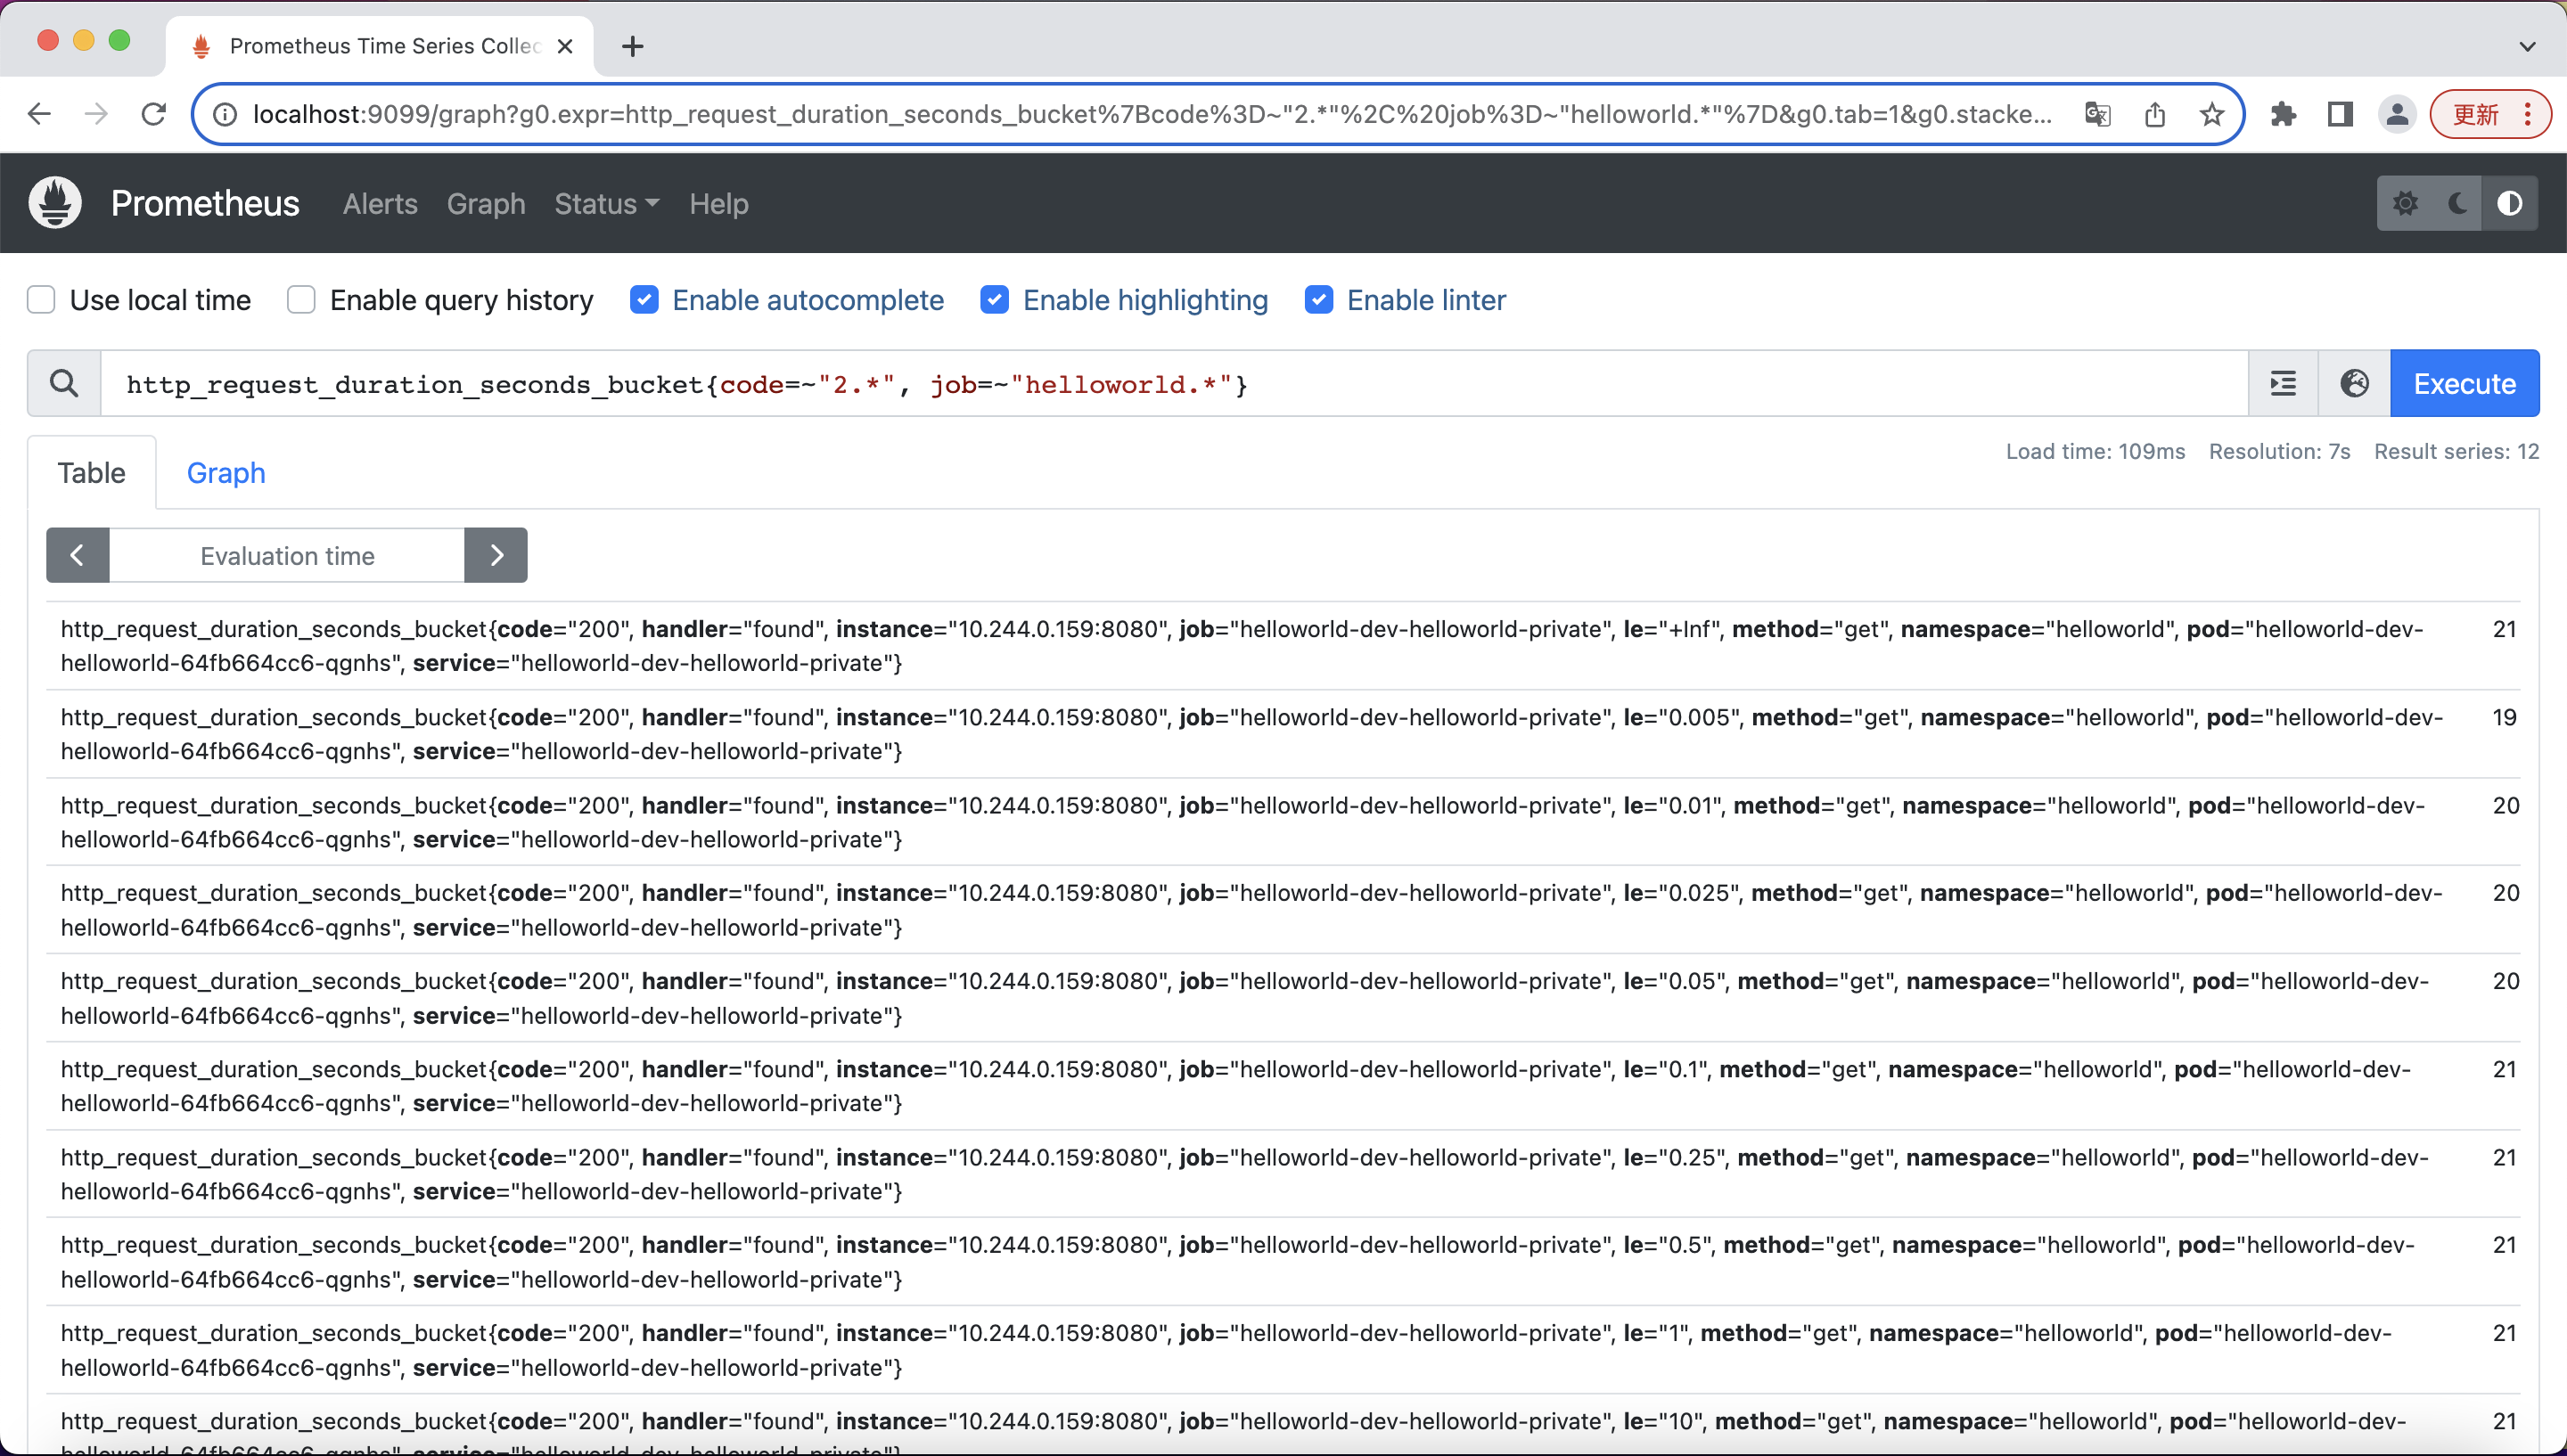
For more info about PromQL, you can find them here[4].
References
- Prometheus: https://prometheus.io/docs/introduction/overview/
- Prometheus team advise: https://github.com/prometheus-operator/prometheus-operator/issues/1547#issuecomment-446691500
- Prometheus operator getting started doc: https://github.com/prometheus-operator/prometheus-operator/blob/main/Documentation/user-guides/getting-started.md
- PromQL basics: https://prometheus.io/docs/prometheus/latest/querying/basics/